Digital forensics is one of the most important elements of ethical hacking, as it allows researchers to learn as much as possible about a network affected by cybercriminals. This requires tools capable of performing various specific tasks, including the analysis of network packets.
On this occasion, experts from the International Institute of Cyber Security (IICS) will show us TCDUMP, a useful tool for capturing and analyzing network packets that allows you to see all incoming and outgoing packets from a specific interface, all from the command line.
According to digital forensics experts, this tool is very similar to WireShark, it also includes additional functions such as the storage of captured packets for later analysis, which can be done even with other hacking tools. However, right now we’ll just look at tcdump’s packet capture capabilities.
Before proceeding, we remind you that this article was prepared for informational purposes and should not be taken as a call to action. IICS is not responsible for the misuse that may occur to the information contained herein.
Installation
Many distributions come with the tcpdump command by default, but if your distribution doesn’t have it, you can easily install it from the official repositories. Below is an example for Ubuntu/Debian distributions:
sudo apt install tcpdum
For Fedora, Red Hat, and CentOS, we’ll use the following command:
sudo yum install tcpdump
Once the installation is complete, we can continue.
TCDUMP Commands
Before moving on to practical examples, digital forensics experts recommend reviewing the syntax and basic options of the tool. The command has the following syntax:
$ tcpdump options -i interface filters
When using the tool, remember to specify the interface to use, since failure to do so will use the first one in the default list. The options customize the display and basic functions of the utility and the filters allow you to filter out unwanted packets. Now let’s look at the main options:
- -A: displays all packages in ASCII format
- -c: closes the program after capturing the umpteenth number of packets
- -C: When writing packages to a file, it checks the size of the file, and if it is larger than specified, a new file is created
- -D: displays a list of available network interfaces
- -e: Displays connection level information for each packet
- -f: displays the domain name for IP addresses
- -F: reads packages from a file, not from an interface
- -G: Creates a new log file after a specific period of time
- -H: detects 802.11s headers
- -i: is the name of the interface for capturing packets. you can capture packets from all interfaces by specifying any
- -I: Switch the interface to monitor mode to capture all passing packets
- -j: Sets the timestamp format for recording packages
- -J: displays available timestamps
- -K: does not check package checksums
- -l: adds scrolling support to the output
- -L: Displays supported connection protocols for the interface
- -n: does not show domain names
- -r: reads packages from a file created with -w
- -v, -vv, -vvv: more detailed output
- -q: displays minimal information
- -w: writes output to a file
- -Z: the user on whose behalf the files will be created
These are not all options, but they will be enough for now. About filters, digital forensics experts mention that these can filter only the types of packets you want to see. You can filter by IP address, protocol, network, interface, and many other parameters.
Using the tool
Before you move on to using tcpdump, you need to see which network interfaces you can use. To do this, just run the command with the -D option:
$ sudo tcpdump –D
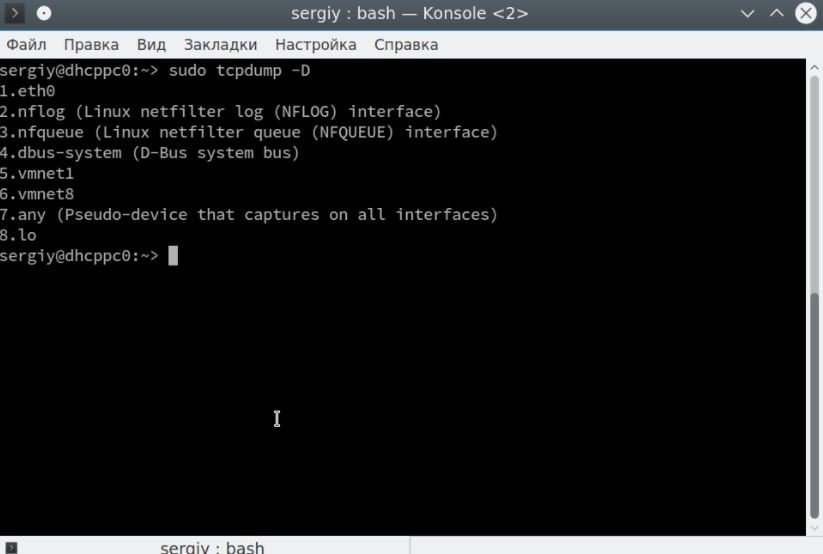
Let’s start looking at examples of tcpdump capturing traffic in the eth0 interface. The program needs superuser rights to work properly, so don’t forget to specify sudo:
$ sudo tcpdump -i eth0
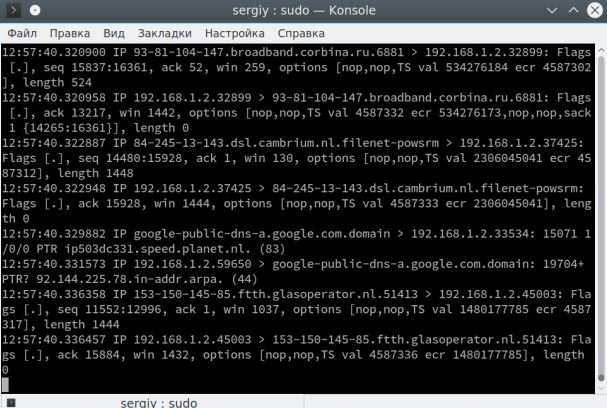
Press Ctrl + C to stop the command. At the exit, you will immediately see all the captured packets. The recording format of each package will look like this:
13: 03: 41.795599 IP udp032919uds.hawaiiantel.net.6881 > 192.168.1.2.52055 : Flags [.], Seq 640160396: 640161844, ack 436677393, win 2050, options [nop, nop, TS val 3805626438 ecr 4677385], length 1448.
First the timestamp is displayed, then the protocol, then the IP address of the sender and the address of the recipient, in this case, our system. Then the additional tcp parameters appear and at the end the packet size in bytes. The verbosity of the output can be controlled with the -v options, for example:
$ sudo tcpdump -v -i eth0
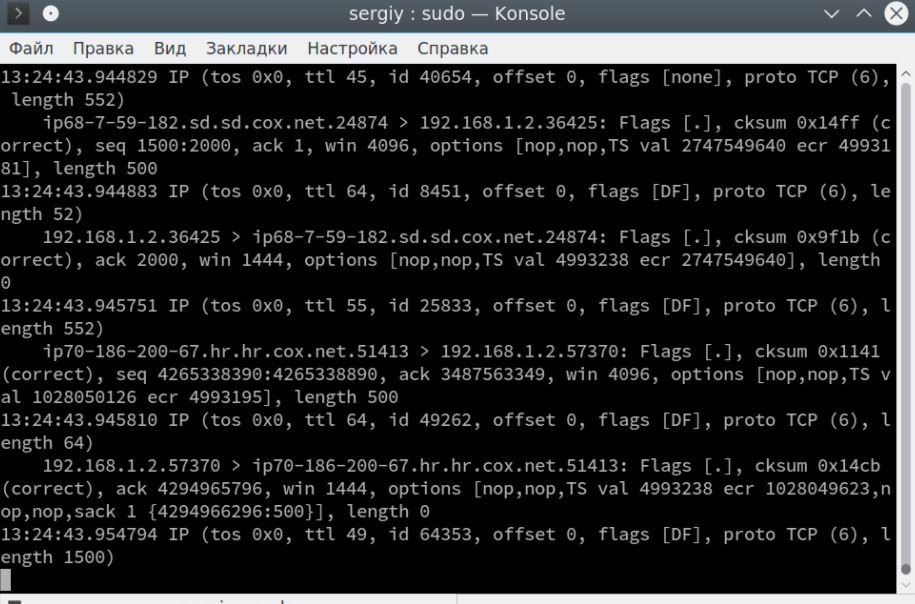
There is already information about the IP protocol here:
IP (tos 0x0, ttl 64 , id 50309, offset 0, flags [DF], proto TCP (6) , length 64)
According to digital forensics experts, we can find information about the life of the TTL packet, the TCP version, and the length of the header field. The -vv option will print the contents and check the sum of the package in some cases. After the options, you can specify filters for packets. Here are the main parameters by which you can filter packets:
- host: host name
- ip: IP address
- proto: protocol
- net: network or subnet address
- port: port address
- src: sender-related parameter
- dst: parameter related to the recipient
The following protocols are available: ether, fddi, tr, wlan, ip, ip6, arp, rarp, decnet, tcp and udp.
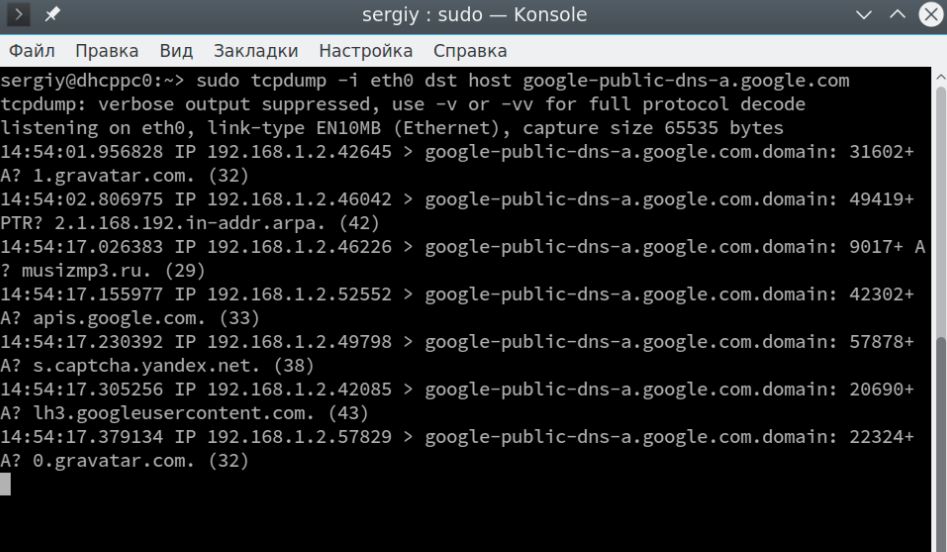
You can combine all this with each other to get the desired result. Let’s take a closer look at the examples. Let’s filter only the packages addressed to our system:
$ sudo tcpdump -i eth0 ip dst 192.168.1.2
We can also select packets sent to a specific node:
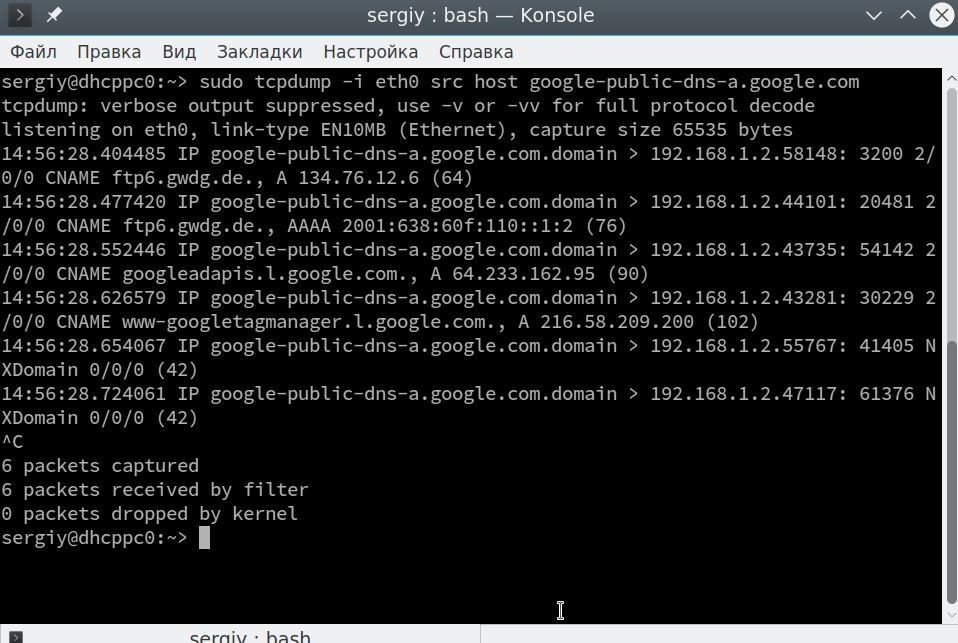
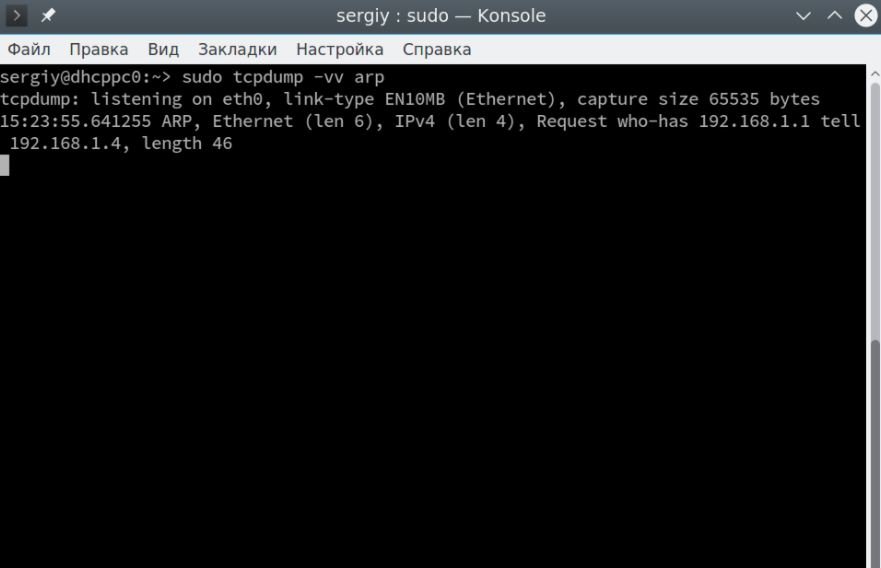
As you can see, these are DNS packets and, instead of TCP flags, it contains useful information, a request for the host’s IP address. You can also select response packets from a specific host:
$ sudo tcpdump -i eth0 src host google-public-dns-a.google.com
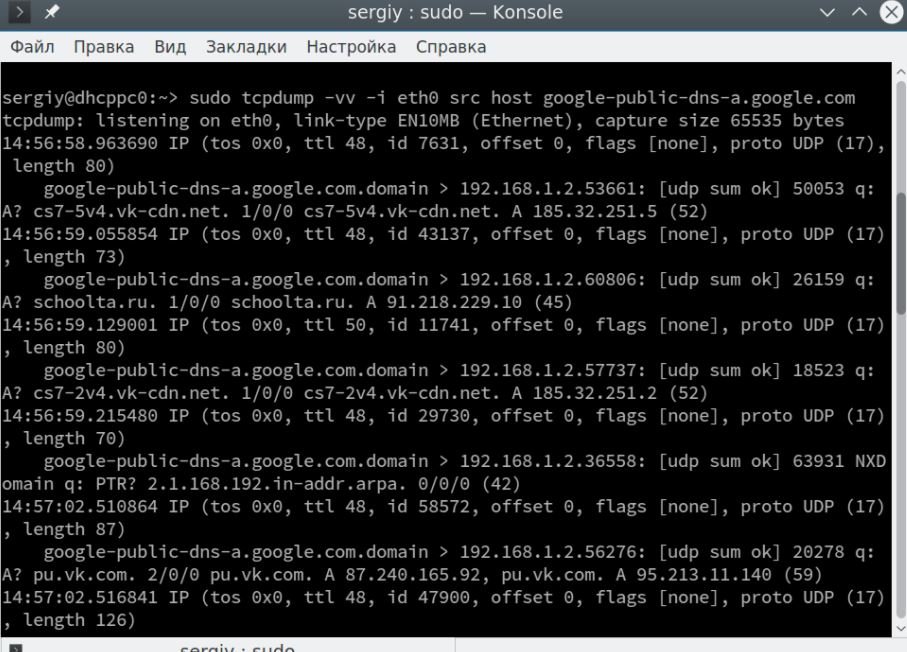
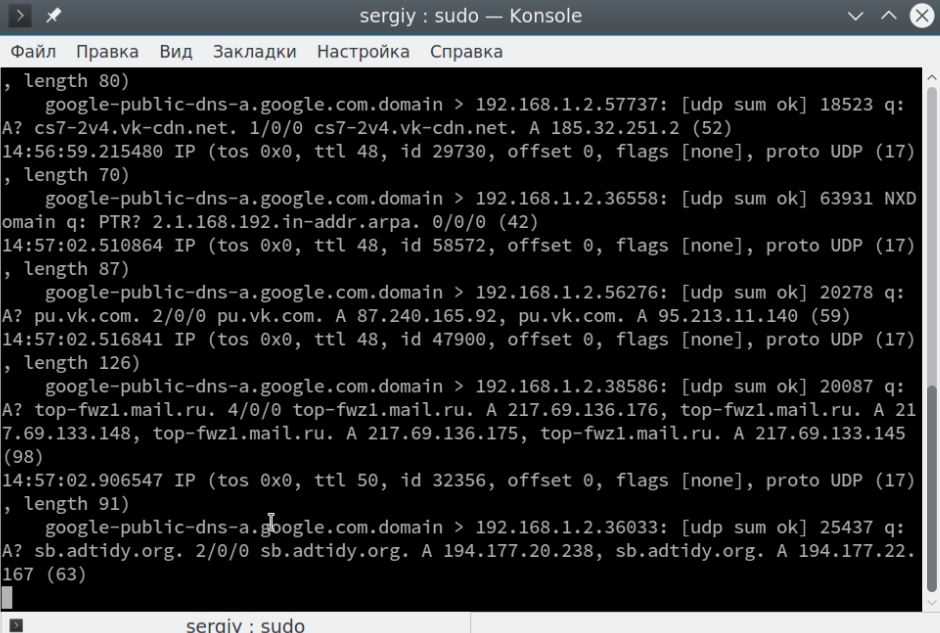
The full contents of the package are not here, if you want to get it, you should use the -v or -vv option, digital forensics experts recommend:
$ sudo tcpdump -vv -i eth0 host dst google-public-dns-a.google.com
With the ‘and’ operator, you can combine several filters into one:
$ sudo tcpdump -i eth0 dst host google-public-dns-a.google.com and src host google-public-dns-a.google.com
It is not necessary to specify the host, in many cases src or dst is enough, the utility will understand what it means by itself. Exactly the same design can be used for ports. For example, we can filter all requests or responses to DNS (on port 53), digital forensics experts point out:
$ sudo tcpdump -vv -i eth0 port 53
You can do exactly the same for http (port 80):
$ sudo tcpdump -vv -i eth0 port 80
Naturally, you can also use dst and src here for more specific results. You can filter not one port, but a wide range of ports:
$ sudo tcpdump portrange 21-23
If you specify one of the protocols, it will filter only packets from that protocol, for example, tcp, udp, or arp:
$ sudo tcpdump -vv arp
You can also select all udp packages:
$ sudo tcpdump -vv udp
A filter by network designation is also available:
$ sudo tcpdump net 129.168.1.1/24
In addition, you can filter packets by their size, for example, less than 32 bytes:
$ sudo tcpdump less 32
Superior packets can also be filtered, digital forensics experts noted:
$ tcpdump greater 128
Sometimes it is necessary to save the captured traffic in a file, for this the -w option is used:
$ sudo tcpdump -i eth0 -w file.pcap
This file can be opened with any program to read such files, for example, Wireshark. To open packages saved in a file, use the -r option:
$ sudo tcpdump -r file.pcap
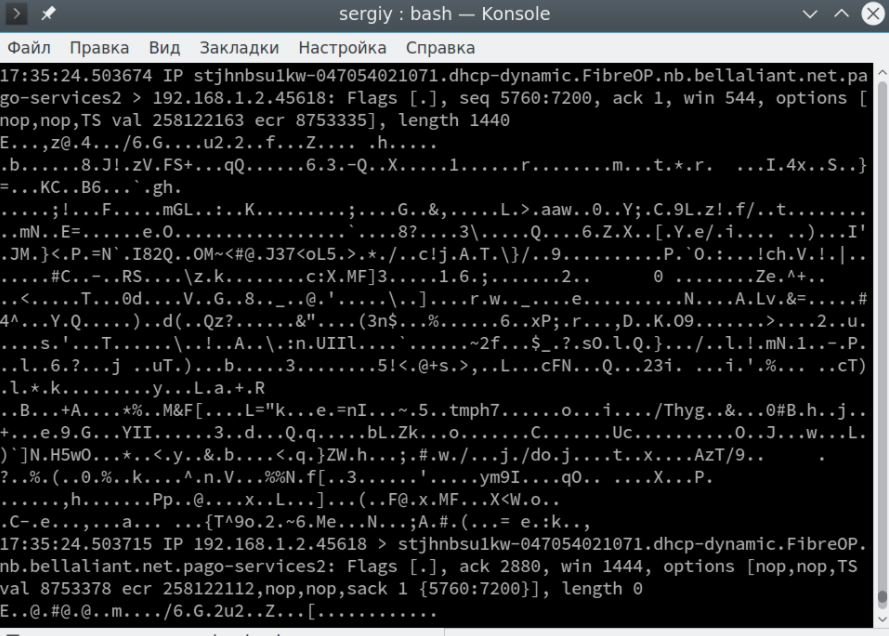
There is one more thing worth paying attention to. This is the format for displaying the contents of packages. You can display the contents of a package in ASCII format using the -A option:
$ sudo tcpdump -A -i eth0
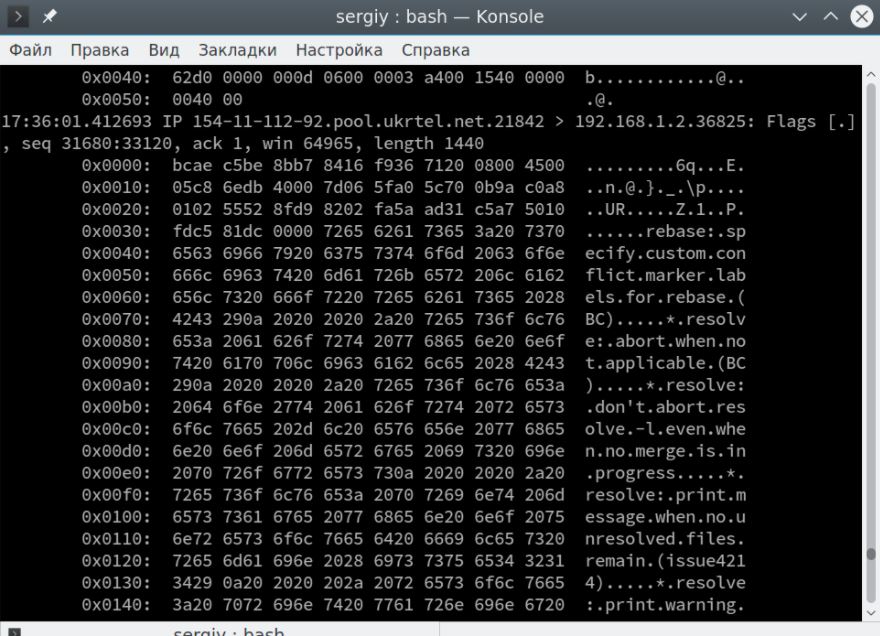
You can also display content in HEX and ASCII format, use -XX for this:
$ sudo tcpdump -XX -i eth0
Conclusions
As you can see, this tool can prove to be really useful for various digital forensics tasks. Before using it in real environments, remember to test in a secure environment or have the permission of the administrator of the scanned system. Use combined with other tools can make TCDUMP one of the best hacking tools at your disposal.
To learn more about information security risks, malware variants, vulnerabilities and information technologies, feel free to access the International Institute of Cyber Security (IICS) websites.


He is a well-known expert in mobile security and malware analysis. He studied Computer Science at NYU and started working as a cyber security analyst in 2003. He is actively working as an anti-malware expert. He also worked for security companies like Kaspersky Lab. His everyday job includes researching about new malware and cyber security incidents. Also he has deep level of knowledge in mobile security and mobile vulnerabilities.